8th Grade Science
  • Home
  • Force & Motion
    • Blog
  • Natural Selection & Adapations
    • Teacher Resources >
      • Blog
  • History of the Earth
    • Resources >
      • 2013-2014 Blog
      • Blog
  • Environmental Science
    • Human Impacts & Natural Resources
    • Weather & Climate >
      • ES Resources
      • Blog 2013-2014
  • Climate Change
    • blog
  • Watershed Ecology
    • Narrative for Educators
  • Weather & Climate
  • Structure, Function & Info Processing
    • Blog
  • Unity and Diversity
    • Blog
  • Giants of Science Biographies
    • Blog
  • Green Avengers
    • Blog
  • Chemistry
    • Daily Blog
  • Teacher Resources
  • Engineering Design
  • Enrichment

8/30 flippin friday

8/29/2013

0 Comments

 
Get your Jar.  Take a look at the layers.  Get a ruler and measure the layer of sand (bottom) then silt (middle) then clay.  Be sure to compare this to the overall total in order to get a percentage.  
Picture
Picture
soil textur analysis
0 Comments

8/28

8/25/2013

2 Comments

 
Make a data table in your notebooks to collect information on your trees/shrubs.  Information to collect will include: date, height, circumference at 2 inches, number of leaves, notes (like 3 yellow leaves, wilting). 
Agenda
Tree Planting
Collect Data
Tree facts
Tree Facts 2
Learning Targets
1.  Plant a Tree!
2.  Collect Data.
3.  Investigate the importance of trees and soil.    
Picture
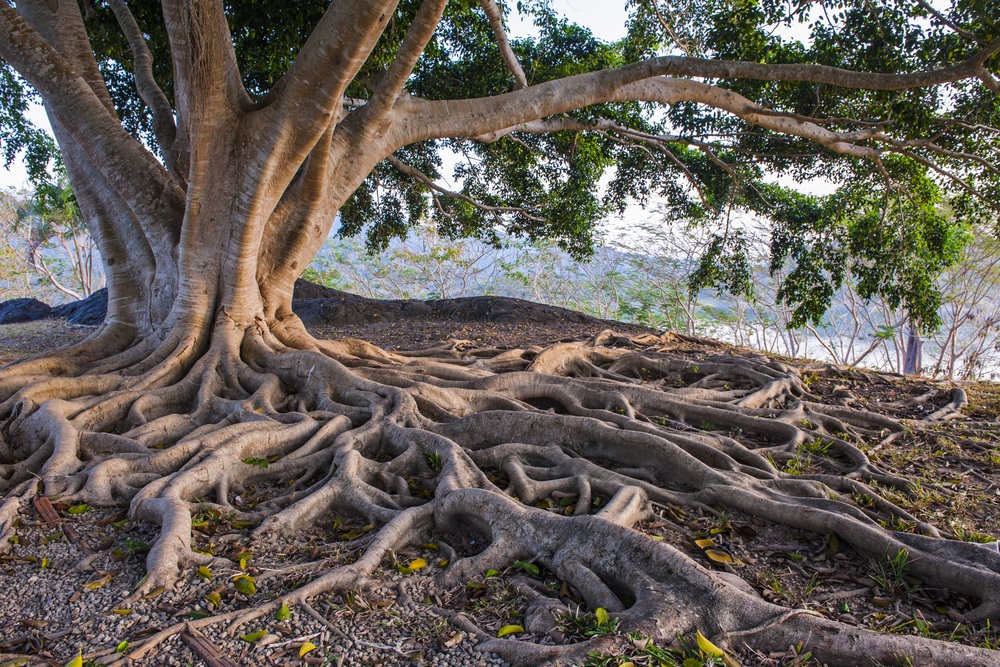
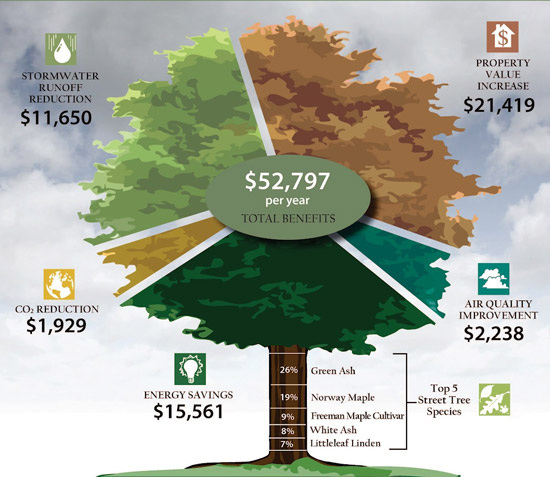
Facts:  Trees help our soil remain healthy by reducing soil erosion and by creating a soil climate suitable for microorganism to grow.
There are over 23,000 different kinds of trees in the world.

2 Comments

8/22

8/21/2013

0 Comments

 
GQ...
1.  Look at the first map.  What type of soil do we have in Henry County?
2. Look at the second map.  What is the area with the highest evidence of soil erosion? 
3.  How much does Henry county 
Picture
Picture
0 Comments

8/19

8/16/2013

2 Comments

 
Why do we need soil? 
Why do we need worms? 
How do we know the quality of our soil?
 
How much land feeds the world? 

Picture
Picture
Picture
Picture
2 Comments

8/16

8/15/2013

2 Comments

 
Tree Facts
  • A single tree can absorb CO2 at a rate of 48 lb. per
    year.
  • Planting trees remains one of the cheapest, most
    effective means of  drawing excess CO2 from the atmosphere.
  • The carbon footprints of 18 average Americans can be neutralized by one acre of hardwood trees.

Agenda
Tree Assignment
Planting our Trees!!!
Targets
1.  Investigate the benefits of trees as carbon sequesters in the battle against climate change. 
Picture
EPA Climate Carbon Calculator
2 Comments

8/15

8/14/2013

0 Comments

 
Picture
GQ.....
1.  What does parts per million mean?
2.  What is the current level of atmospheric CO2 today?
3.  What was it in 1950?
 
4.  What was the highest concentration before 1950?
5.  Do you notice a pattern?  explain
6.  How do you think we know CO2 concentrations from 650,000 years ago?
 

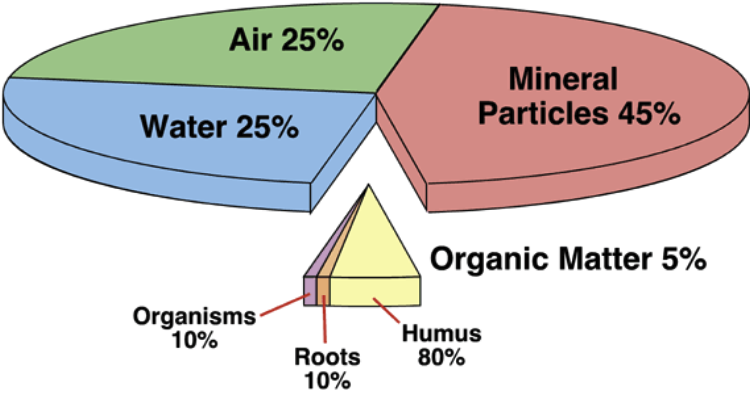
Any other questions you have regarding this graph? 
0 Comments

8/14

8/13/2013

0 Comments

 
GQ..........
1.  What is the greenhouse effect?
2.  What gases are greenhouse gases?
3.  How do they contribute to climate change? 


Agenda
GQ
11th Hour
Discussion 
Recycling
Learning Targets
1.  Investigate Global Environmental Issues and solutions.
 

Picture
Picture
0 Comments

    Author

    Write something about yourself. No need to be fancy, just an overview.

    Archives

    May 2014
    April 2014
    March 2014
    February 2014
    January 2014
    December 2013
    November 2013
    October 2013
    September 2013
    August 2013

    Categories

    All

    RSS Feed

Powered by Create your own unique website with customizable templates.